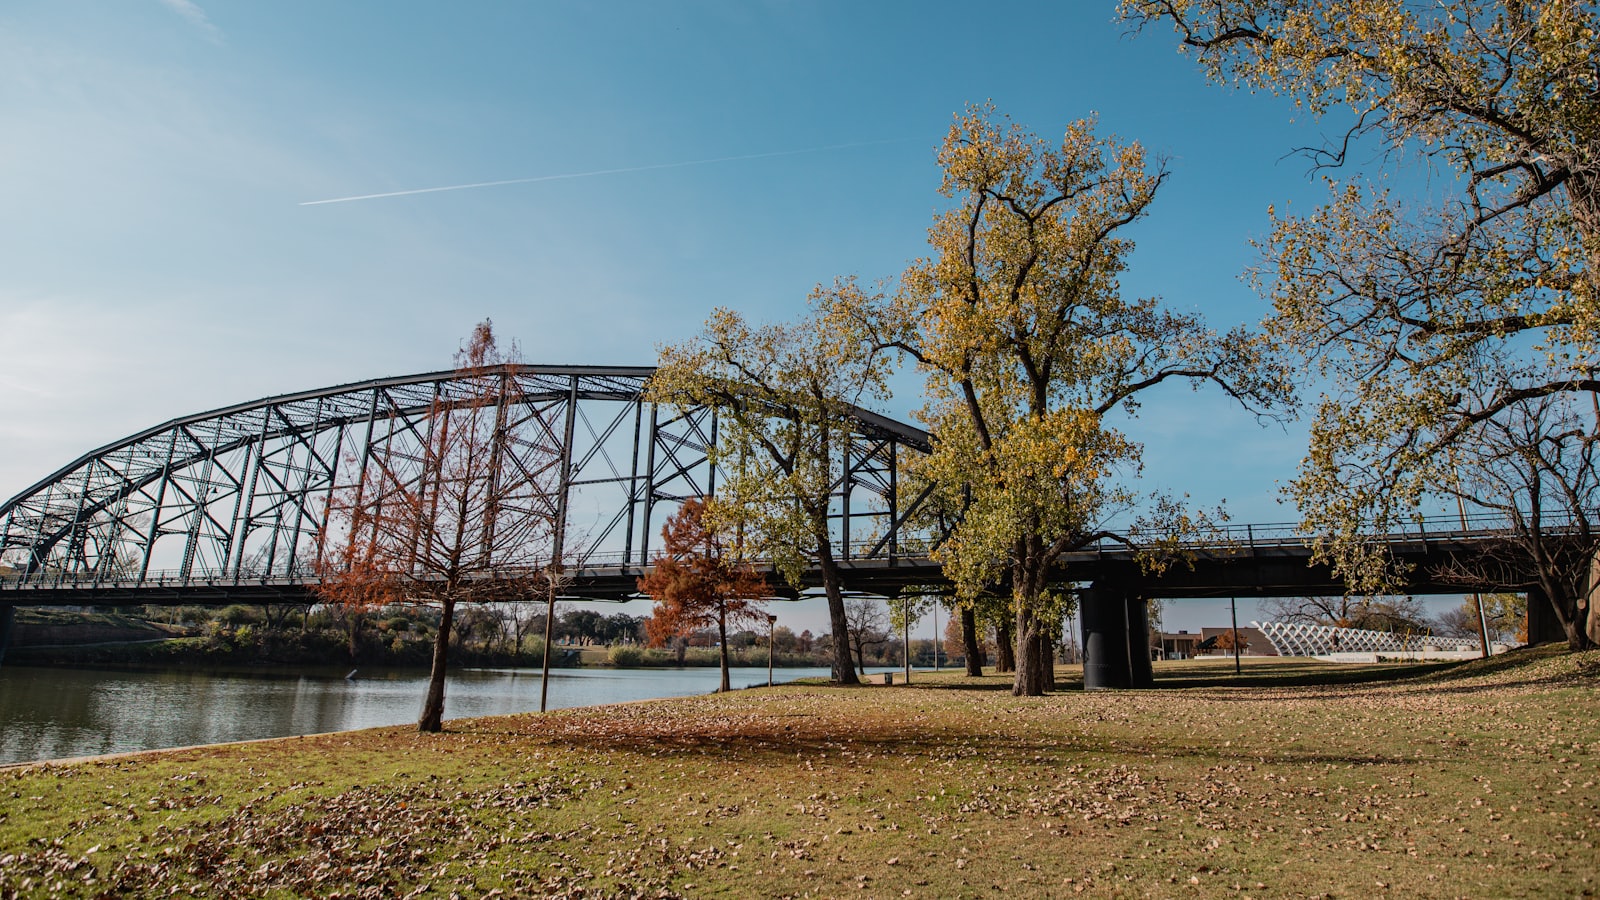
Texas owns more bridges than any other state, and by the numbers it keeps them in unusually good shape. That pairing is the whole story of the state's bridge program: a network too large to ignore, held to a condition record most states with a fraction of the inventory struggle to match. The evidence is not a slogan. It is inspection data, collected on a fixed schedule and reported into a federal database that lets any state be measured against the same yardstick.
How a bridge gets a grade
Every public bridge in the country is logged in the Federal Highway Administration's National Bridge Inventory. Under the National Bridge Inspection Standards, structures are examined on a set cycle, generally at least once every twenty-four months, with the soundest bridges eligible for longer intervals and the worst inspected more often. Inspectors rate a bridge's deck, superstructure, and substructure on a zero to nine scale, and the lowest of those component ratings decides the bridge's overall condition.
That overall condition now comes in three words: good, fair, or poor. The older label many Texans still remember, structurally deficient, was retired by the FHWA in 2018 in favor of the poor rating, which flags a bridge whose key component has dropped to a four or below. A poor rating is a maintenance priority, not a declaration that a bridge is unsafe or about to close. A structure that genuinely could not carry traffic safely is posted for reduced loads or shut, which is a separate action with separate rules.
The Texas numbers
TxDOT compiles the state's slice of that federal data in its recurring Report on Texas Bridges, and the totals are large. Texas carries the biggest bridge inventory in the nation, well over 55,000 structures on and off the state highway system, close to twice the count of any other state. Against that base, the share rated in poor condition sits at roughly one percent, one of the lowest proportions in the country. Read those two facts together and the achievement is clearer than either alone: the state maintains the largest stock of bridges anywhere in the country while holding the poor-condition share near the floor.
The trend has pointed the right way as well. The count of Texas bridges flagged as structurally deficient, and later as poor, has drifted down over recent years rather than up, even as the inventory itself grew with the state. Holding a condition percentage steady while the denominator keeps rising means the state is not merely maintaining old bridges. It is building and replacing fast enough to keep pace with its own population growth.
Who owns the other half
Not every bridge in the count belongs to the state. A large share sit off the state highway system, owned by counties and cities that lack a highway department's budget or in-house engineers, and those off-system structures are where a low statewide average can hide local trouble. TxDOT still inspects them and steers federal bridge funding toward the worst, because a county road bridge posted for reduced weight forces school buses and fire trucks onto longer detours in exactly the rural places least able to absorb the delay. The uniform federal inventory matters most here. It is the reason a span on a farm-to-market road gets the same zero to nine scrutiny as an interstate flyover, and the reason a small county cannot quietly let one slide until it fails. A statewide average near the top of the national table is built partly from thousands of these small, unglamorous structures being checked on the same clock as the big ones.
Why the record holds, and where it strains
A low poor-condition share is bought, not lucky. Texas funds a dedicated highway bridge program that replaces and rehabilitates structures on a rolling basis, and a young, well-inspected bridge stock is the direct result of steady capital spending across decades. The same discipline that keeps I-35 under near-constant reconstruction, described in our look at the state's busiest corridor, applies to the smaller structures nobody photographs: the overpasses, the farm-road spans, the culverts that carry a two-lane county road over a dry creek.
The strain is not evenly spread. The bridges that draw the most concern are often the oldest rural ones and the heavily loaded urban interchanges, and load is the variable that ties bridges to the rest of the network. Every fully loaded truck on a span is stress the deck absorbs, which is why the health of the bridge inventory cannot be separated from the growth of freight and trucking across the state. More tonnage on the same structures shortens the interval between rehabilitations, whatever the headline condition number says.
What the data cannot tell you
A condition rating is a snapshot of structure, not of capacity or convenience. A bridge can rate good and still be too narrow for the traffic it carries, or sound but functionally awkward at an interchange that jams every evening. The National Bridge Inventory measures whether a bridge is deteriorating, not whether it is the right bridge for the demand now crossing it, and the second question is often the one drivers actually feel.
Set against the state's water systems and its wider infrastructure backlog, bridges are the part of the physical state Texas can most credibly say it is on top of. The counts are public, the method is uniform, and the trend is favorable. The task is to hold that line as the inventory grows, because a one percent poor share of 55,000 bridges is a very different maintenance bill from one percent of half that number, and the number is only going up.