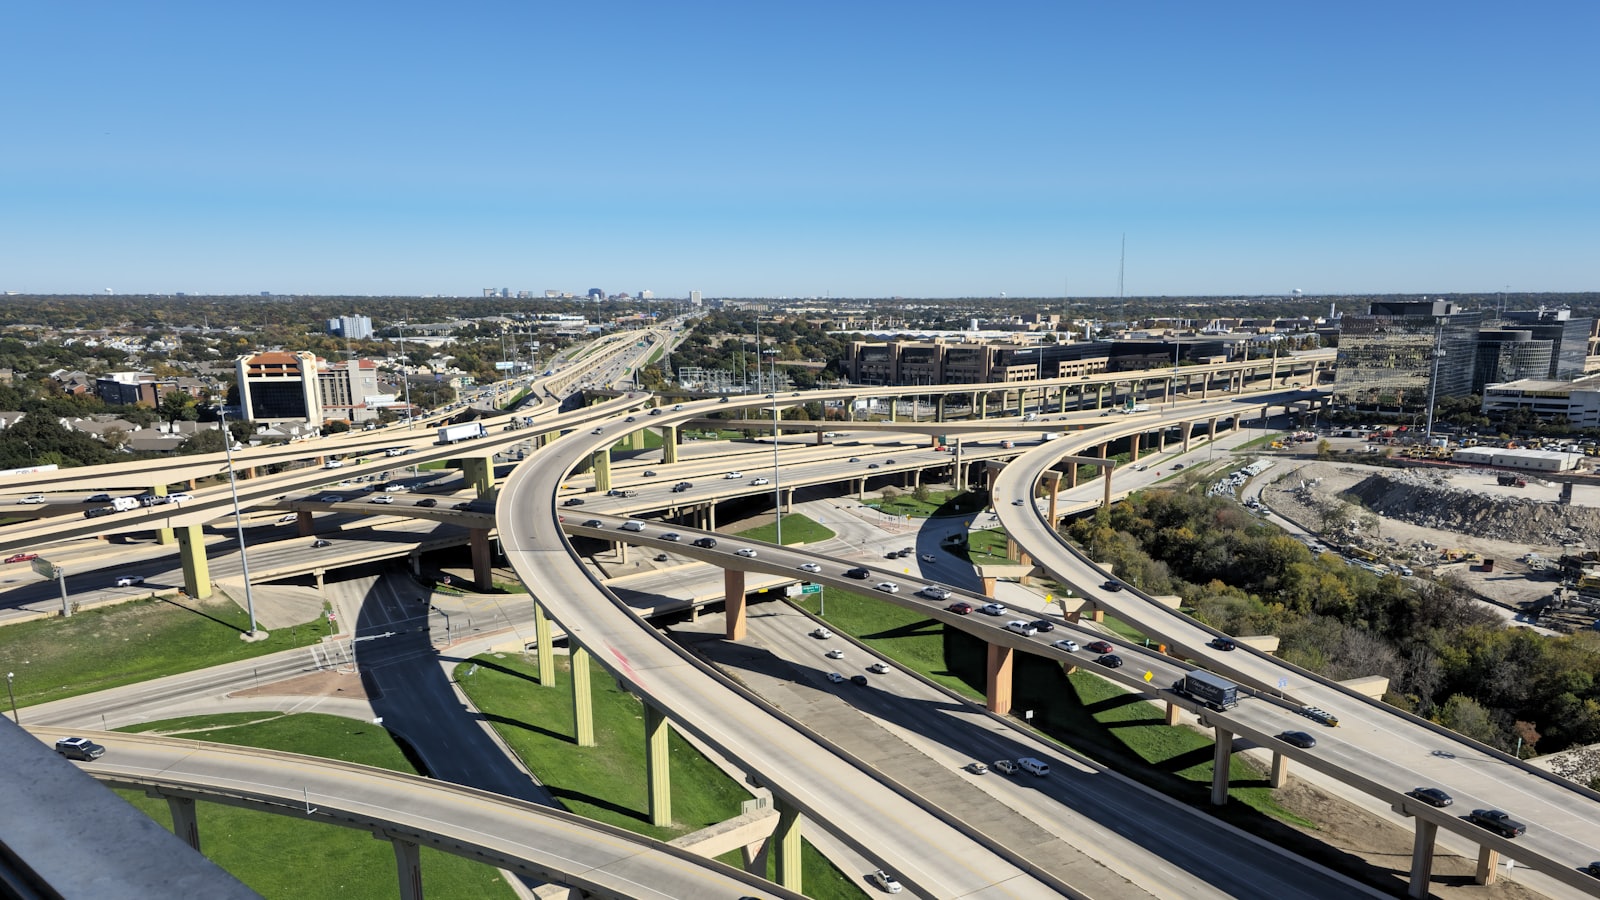
Texas has not gone a single day without a death on its roads since November 7, 2000. TxDOT tracks that streak deliberately, under the banner of its #EndTheStreakTX campaign, because the number it produces is almost too large to feel: more than two decades in which every sunrise has arrived with at least one fatal crash somewhere in the state. In 2023 the toll reached 4,291 people, by TxDOT's count, an average close to a dozen deaths a day.
The record behind the number
Those figures do not come from an estimate. Every fatal crash a Texas peace officer works generates a report that flows into the Crash Records Information System, or CRIS, the database TxDOT uses to compile its annual crash statistics. The same fatal cases are also counted federally: the National Highway Traffic Safety Administration runs the Fatality Analysis Reporting System, a census rather than a sample, which records every crash on a public road that kills someone within thirty days. Two agencies counting the same deaths by different routes is part of why the fatality figure is among the more reliable numbers in Texas government.
What the datasets are better at describing is scale than cause. CRIS records a crash's location, road class, weather, and a set of contributing factors an officer marks at the scene, but a marked factor is a judgment made in the aftermath, not a proven chain of events. Reading the data honestly means treating those fields as what an investigating officer recorded, not as a settled verdict on why a person died.
Where the deaths are, and where they are not
The intuition that danger lives in the big-city interchange is only half right. Urban Texas produces more crashes because it holds more people and more vehicles, and a corridor like the one described in our reporting on the I-35 spine through Austin concentrates enormous volumes of traffic in a small space. But volume and lethality are not the same thing. TxDOT's annual statistics have long shown a large share of the state's traffic deaths occurring on rural roads, where higher speeds, two-lane geometry, longer distances to a trauma center, and the absence of medians turn a smaller number of crashes into a disproportionate number of funerals.
That split is the single most useful thing the crash record teaches. A minor collision on a congested freeway is survivable in a way that a head-on wreck on an undivided farm-to-market road at highway speed often is not. The places with the most crashes and the places with the most deadly crashes are not the same map, and any read of Texas road safety that ignores the distinction will chase the wrong problem.
Corridors, not points
Naming the single most dangerous road in Texas is harder than it sounds, and the honest answer is that it depends on how the question is framed. Ranked by raw fatal-crash counts, the heavily traveled interstates through the major metros rise to the top simply because so many vehicles use them. Ranked by deaths for each mile driven, quieter rural highways often look worse. Ranked by trend, the corridors seeing the fastest growth in traffic, many of them tied to the freight economy detailed in our piece on Texas freight and trucking, are where new risk is being manufactured about as fast as the state can pave for it.
This is why TxDOT and independent analysts tend to speak in corridors rather than points. A dangerous stretch is usually a length of road with a shared design and traffic pattern, not a single cursed intersection, and safety spending follows that logic: rumble strips, cable barriers, wider shoulders, and better lighting applied along segments the data flags, rather than one fix at one spot.
The factors the record keeps naming
Year after year, the contributing factors that recur in the Texas fatal-crash record are the familiar ones the #EndTheStreakTX campaign built its messaging around: speed, impairment, failure to use a seat belt, and distraction. TxDOT publishes these breakdowns from CRIS, and the consistency across years is itself the finding. The lethal ingredients of a Texas traffic death change little from one annual report to the next, which is a large part of why the daily streak has proven so hard to break.
It is worth being careful with those categories. That a factor appears often in the record does not, by itself, prove how many deaths it caused or would prevent if removed, because crashes usually involve several factors at once and the data captures association more cleanly than causation. The value of the breakdowns is directional. They tell the state where to aim, even when they cannot promise what a given countermeasure will save.
Why the streak resists the fix
The uncomfortable subtext of the fatality data is that Texas keeps growing. More residents, more registered vehicles, and more miles driven each year push the raw number of exposures up even when the rate of death for each mile improves. A safety record can get better per person and still deliver a rising body count if the population underneath it is expanding fast enough, a tension that runs through much of this publication's coverage, including the heavy trucks sharing these same lanes.
That is the sober way to read TxDOT's streak. It is not evidence that nothing works, and it is not proof that Texas roads are uniquely deadly. It is a measure of a very large state moving a very large number of people over very long distances, counted with unusual precision by two agencies whose numbers agree. The public safety desk follows that count because the figure behind it is not an abstraction. Each day the streak continues, the record adds another name.